Almost every OKR statistic below comes from original research — the ROI of OKRs: 2026 Benchmark Report (330 organizations), the 2026 OKR Benchmark Report (200+ organizations), the OKR Intelligence Report 2026 (222 organizations), and The State of Goal Management (210 employees). Three independent studies and the first employee-level research on goal-gaming behavior.
OKRs have become the default goal-setting framework for high-growth organizations — not because of hype, but because the data on what they deliver is now specific and verifiable.
To build this guide, we conducted four original research programmes: the ROI of OKRs: 2026 Benchmark Report (330 organizations across the technology sector), the 2026 OKR Benchmark Report (200+ organizations), the OKR Intelligence Report 2026 (222 organizations), and The State of Goal Management (210 full-time employees at growing companies) — the first study to measure goal-gaming behavior directly rather than inferring it from completion data. No OKRs Tool customers in any sample.
This article pulls the most significant findings across all four — covering ROI, adoption, execution habits, failure patterns, AI usage, and goal-gaming behavior.
Key OKR Statistics at a Glance
OKR Adoption Statistics
Rapid Uptake in Recent Years
Over half of companies using OKRs are relatively new to the methodology — 52% have been using OKRs for less than three years. However, many still feel they have a long way to go, with 71% stating they haven't fully mastered OKRs yet.
This shows that while adoption is high, there's significant room for growth in execution and understanding.
Top-Down Introduction
A significant 90% of companies introduce OKRs through leadership teams, aiming to improve corporate governance and strategic alignment from the top down. This indicates that OKRs often play a role in transforming how companies align their teams and set direction.
Despite widespread adoption, alignment remains a challenge. 65% of teams admit their OKRs are not directly linked to company goals. This gap often limits the impact of the framework. Teams that connect departmental OKRs to overarching company objectives see far stronger alignment and execution.
Key Motivations for Adopting OKRs
The primary motivations behind adopting OKRs are improving alignment and performance. In a global survey, 61% of companies cited better alignment, and 61% also mentioned performance improvement as the top reasons.
According to our own data, most objectives fall into three categories:
- Business growth and revenue: 40%
- Product development and improvement: 35%
- Marketing and customer acquisition: 25%
Dedicated OKR Roles
Over 80% of companies using OKRs have an OKR champion or a similar role dedicated to overseeing the OKR process. This reflects the growing recognition that having someone focused on driving the process is crucial for successful implementation.
Communication and Regular Check-ins
OKRs thrive on consistent communication.
Companies with the most success using OKRs show 28% higher communication intensity. These teams conduct OKR check-ins frequently to ensure alignment and stay on track. Regular communication is critical to keeping everyone on the same page and adapting quickly to changes.
Regular check-ins are one of the strongest predictors of OKR success. Teams that review their OKRs weekly achieve 43% higher goal completion rates compared to those that only check in quarterly. Integrating OKRs into weekly team rhythms helps maintain focus, accountability, and progress throughout the cycle.

OKR Cadence
The most common cadence for OKR planning is quarterly, with 70% of companies setting OKR cycles every quarter. Over 60% of organizations conduct check-ins at least bi-weekly. This frequent review helps teams adjust and focus on the right priorities.
End-of-cycle reviews also have a measurable impact. Teams that conduct structured OKR retrospectives at the end of each cycle complete 30–45% more objectives than those that skip them.
Use of OKR Software
While spreadsheets are still the go-to tool for many early teams, our research found that 56% of organizations eventually transition to OKR software after hitting friction with manual tracking.
Recommended OKR software tools:
1. OKRs Tool. Built for team leads and department heads inside growing companies who need OKRs working this quarter — without IT approval, procurement cycles, or a consultant.
2. Tability. Combines OKRs with lightweight check-ins and progress updates. Good fit for teams that want tighter weekly execution.
3. Perdoo. An established OKR platform with strong strategy mapping and alignment features. Well-suited for organizations with defined structures and multi-layer OKR visibility.
Most Teams Still Don't Feel Mastery
71% of companies say they have not yet fully mastered the OKR process, indicating that while OKRs can be effective, they require continuous effort and adaptation. This lack of mastery shows up clearly in how teams write their OKRs — with over half of key results functioning as KPIs rather than outcome-driven measures.
Focus on Results
61% of companies adopted OKRs primarily to improve results. Teams where every OKR has a defined owner achieve 26% stronger results on average. Organizations that launch OKRs in under a week report up to 50% higher completion rates.
Business Impact of OKRs
Positive Impact on Business
98% of organizations report measurable impact from OKRs, with 61% seeing direct improvement in revenue growth. Our benchmark data shows that OKRs deliver a 1:25 return on investment — every $1 invested generates an estimated $25 in return.

Based on our original research report, 62% of companies see measurable impact from OKRs within a single quarter.
Operational Impact
Revenue is the headline. The operational returns are equally significant — and in many cases, more immediate.
- 95% report a reduction in wasted or misaligned work
- 86% of organizations report faster decision-making after adopting OKRs
- 60% report measurable improvement in strategic clarity
These operational returns compound. Strategic clarity reduces the cost of every downstream decision, shortens onboarding time, and creates the shared language that allows distributed teams to move in the same direction without constant coordination overhead.
Strategic Clarity Across the Company
In companies using OKRs, 72% of employees understand the company's vision, compared to just 50% in organizations without OKRs.
Agility and Confidence
67% of employees in OKR-driven companies believe their company can respond quickly to changes, compared to just 50% in companies without OKRs.
Higher Employee Engagement
78% of employees in OKR-driven organizations report higher job satisfaction compared to 65% in companies without OKRs.
Improved Sales Productivity
After implementing OKRs with 20,000 employees, Sears saw an 8.5% increase in sales per hour per employee.
OKRs Lead to Higher Revenue Growth
One report found that companies using OKRs achieved nearly 60% higher revenue growth on average, thanks to better alignment and focus.
Increased Likelihood of Achieving Goals
Companies that implement OKRs are 39% more likely to achieve their goals compared to those without structured objectives. One of the biggest benefits of OKRs is easier goal tracking, with 22% of companies ranking it as the top advantage.
What Is the Biggest Benefit of Using OKRs?
Faster Growth with OKRs
Companies with well-implemented OKRs grew 2.5 to 4 times faster than their counterparts without OKRs. This reinforces the value of a structured, aligned approach to goal-setting for long-term growth.
The Execution Gap
The benchmark data tells a consistent story: the gap between what OKRs can deliver and what most organizations are actually capturing is an execution problem — not a framework problem.
- Only 5% of teams have more than 75% of their weekly work tied to an OKR
- The largest group — 45% of respondents — operates at 26–50% alignment
- A further 23% report alignment of 25% or below
- Only 49% of leaders review OKRs consistently every week
- The remaining 51% do so sometimes, rarely, or never
The 1:25 return is being generated by organizations where fewer than half of all working hours are OKR-aligned. The ceiling is still a long way up for most teams.
OKR Execution Habit Statistics
The following habits have the highest correlation with OKR completion rates across the benchmark data.
Weekly Check-Ins
- Teams with weekly check-ins complete 43% more OKRs than those reviewing monthly or ad hoc
- Teams that skip check-ins entirely are 3x more likely to abandon OKRs altogether
- Teams spending 45+ minutes per week on OKRs perform worse than those under 30
- The sweet spot: 15–20 minutes, focused on blockers, decisions, and next steps
Ownership
- 50% of all Key Results have no named, single owner
- Teams with clear single ownership per KR see 26% higher completion rates than those with shared or vague ownership
Fast Rollout
- Teams that launch OKRs in under a week see up to 50% higher completion rates than those that delay
- The first 30 days of a cycle strongly predict the rest of the quarter
Goal Structure
- Teams running 1–2 OKRs per quarter are 2x more likely to achieve them as those running 3 or more
- Teams with 1–2 KRs per objective outperform those with 4+ KRs on the same objective
Retrospectives
- Teams that run end-of-cycle retrospectives complete 30–45% more OKRs the following quarter
- By cycle 5+, teams complete 20.3% more goals than those in their first two cycles
OKR Failure Pattern Statistics
From 330 organizations, the most common OKR failure modes:
From teams that abandoned OKRs entirely: 35% blamed low engagement, 24% cited no clear ownership, 12% cited complexity. Most OKRs don't fail — they're abandoned because no system keeps them alive.
Goal-Gaming and Honesty Statistics
These statistics come exclusively from The State of Goal Management — OKRs Tool original research, 210 full-time employees at growing companies, 2026. The first study to measure goal-gaming behavior directly rather than inferring it from completion data.
92% of employees admit to at least one form of goal-gaming — sandbagging, inflating progress, or writing goals to impress leadership.
89% have sandbagged — set a goal they had already mostly achieved.
70% have reported a goal as healthier than they knew it to be (watermelon reporting).
50% have written a goal mainly to look good rather than to change anything.
43% admit to all three behaviors in the same cycle.
96% sandbag when goals directly affect performance ratings — versus 81% when goals are kept separate from ratings.
34% say nothing about how they work would change if their goal tracker were deleted tomorrow.
30% of employees can name all of their company's current top goals without looking them up.
59% of employees who cannot name company goals say nothing would change if their tracker were deleted. Among those who can name all company goals, only 24% say the same.
Key Result Quality Statistics
From our analysis of 20,952 across 876 orgs::
- 52% of Key Results were KPIs or tasks in disguise — measuring activity, not change
- Teams that connect goals to outcomes rather than outputs are 30% more likely to hit them
- The most common underperforming KR verb: "Conduct" (100 instances) — a task, not an outcome
- The most common high-performing KR verb: "Increase" (336 instances) — directional and measurable
AI in OKRs
These statistics come exclusively from the OKR Intelligence Report 2026 — 222 organizations across the technology sector, 51–200 employees, all confirmed active OKR implementation. No OKRs Tool customers in the sample.
83% of organizations are actively using AI in their OKR process right now — not piloting, not planning to, using it this quarter.
Only 13% use AI-generated OKR suggestions as-is. 47% treat AI as a strong starting point that always needs human refinement. 20% use it for inspiration only — rewriting substantially.

The most common AI usage split: 34% use AI for analysis only (surfacing risks, flagging misalignment). 31% use AI for writing only. The analysis use case is closing fast.
Where AI has had the most impact (among 178 active AI users): writing better-quality Key Results (51%), identifying team/company misalignment (49%). Just 2 percentage points apart — AI is already operating as a strategic lens.
Teams using AI for both writing and analysis accept a low score on missed OKRs only 14% of the time — the most proactive response pattern of any group. Teams using AI for writing only accept a low score 35% of the time.
The #1 AI concern is data privacy and security — cited by 25% of respondents. This outranks output quality (19%) and leadership trust (16%).
Strategy Execution Statistics
These statistics come exclusively from the Strategy Execution Benchmark 2026 — OKRs Tool original research, 180 strategy and operations leaders at companies of 50–200 employees, all confirmed accountable for how strategy gets executed. No OKRs Tool customers in the sample. It's the first study to measure where strategy decays after the plan is set, rather than why plans are weak.
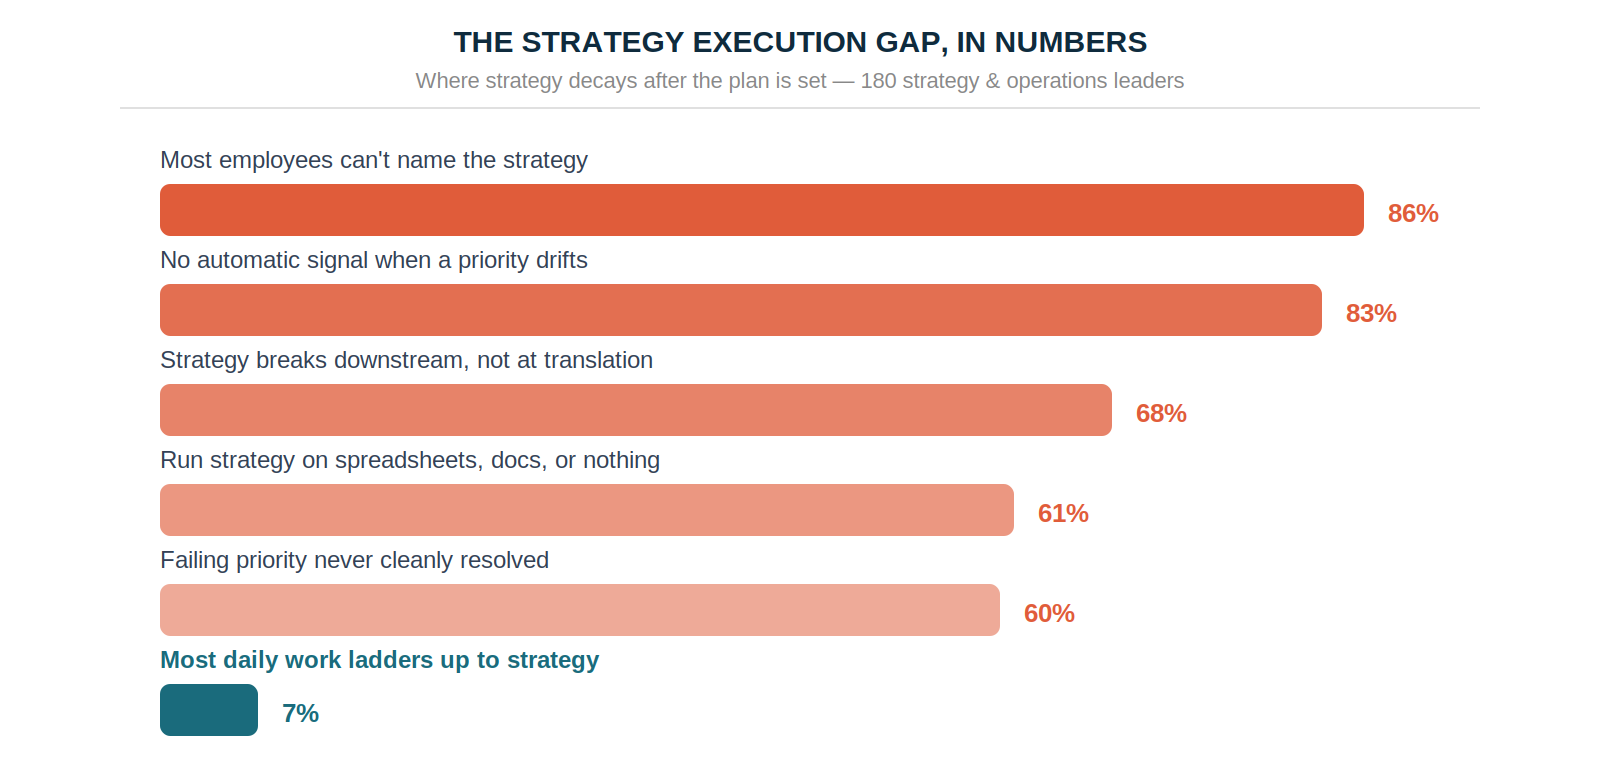
In 86% of companies, most employees can't name the top strategic priorities unprompted. Only 14% of leaders say more than three-quarters of their people could state the strategy right now.
Only 7% of leaders say most daily work ladders up to strategy. Nearly two-thirds put it at half or less — the gap between what a company decided to do and what its people actually spend their hours on.
83% of leaders get no automatic signal when a priority drifts off track. Only 17% learn from a tool that surfaces it; the rest find out at a review, through an escalation, or from a customer — after the drift has already happened.
60% of failing priorities are never cleanly resolved. When a strategic priority is clearly failing mid-cycle, only 40% of leaders say it gets formally revised or killed — the rest are quietly dropped or limp to the end of the cycle.
68% of leaders say strategy breaks downstream — in sustaining and measuring — not at translation. Only 23% point to the initial handoff into team work as the failure point. The hard part isn't the kickoff; it's everything after.
61% run strategy execution on spreadsheets, docs, or nothing central at all. Just 22% use purpose-built software — the rest rely on infrastructure that can't surface drift or force a decision.
21% take a month or more to learn a priority is off track. Because visibility is pull rather than push, problems arrive late, and late detection is what lets a strategy die without anyone deciding to kill it.
OKR Software Market Statistics
Growth of OKR Software
The OKR software market is growing rapidly. In 2022, the global market for OKR software was valued at around $1 billion and is expected to reach $5 billion by 2034, with a CAGR of 14.6%.
North America currently leads. However, the Asia-Pacific region is expected to have the fastest-growing market in the coming years.
Software ROI Comparison
Our study found that 40% of organizations continue to use spreadsheets as their primary OKR tracking tool. The ROI difference is significant:
Enterprise software doesn't just cost more — it generates a lower return than spreadsheets. Purpose-built, lightweight OKR software generates 1:88 — more than three times the spreadsheet return and more than five times the enterprise software return.
What the Data Tells You to Do Differently
The pattern across all four research programmes is consistent. OKR completion is predicted by structure — named ownership, weekly cadence, fast launch, honest scoring, and end-of-cycle retrospectives. The 1:25 return is a floor — it's being generated before most organizations have applied all five habits consistently. The teams at 1:88 have.
The State of Goal Management data adds the layer the completion numbers don't show: 34% of employees say nothing would change if their goal tracker were deleted tomorrow. Improving completion rates matters. Building a goal management system that's genuinely load-bearing matters more.
See how OKRs Tool implements the structural habits these statistics point to — cascade alignment, automated weekly check-ins, named ownership enforced at goal creation, and AI at-risk detection — free for up to 5 users.
About This Research
The statistics in this guide come from three independent research programs:
ROI of OKRs: 2026 Benchmark Report — 330 respondents, technology sector, all confirmed active OKR implementation. Fielded March–April 2026. No OKRs Tool customers in sample.
2026 OKR Benchmark Report — 200+ organizations. Execution habits, check-in frequency, cycle completion data, maturity curve analysis.
OKR Intelligence Report 2026 — 222 respondents, technology sector, 51–200 employees, all full-time employed, all confirmed active OKR implementation. No OKRs Tool customers in sample. Download the full report →
The State of Goal Management — 210 full-time employees at growing companies, 2026. The first study to measure goal-gaming behavior directly — sandbagging, watermelon reporting, and goal honesty — rather than inferring it from completion rates. No OKRs Tool customers in sample. Download the report →
Strategy Execution Benchmark 2026 — 180 strategy and operations leaders at companies of 50–200 employees, all confirmed accountable for strategy execution. The first study to measure where strategy decays after the plan is set. No OKRs Tool customers in sample. Download the full report →
All findings are self-reported and reflect respondents' own assessment of their OKR programmes. We have been deliberately transparent about methodology because an honest number is more valuable than an impressive one.